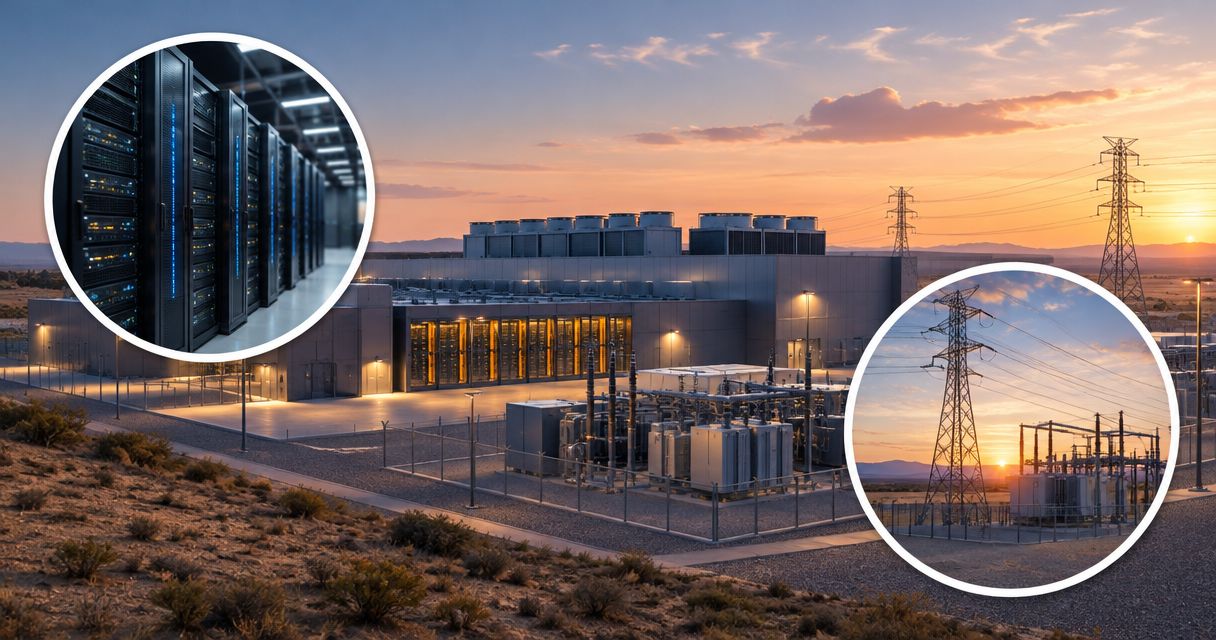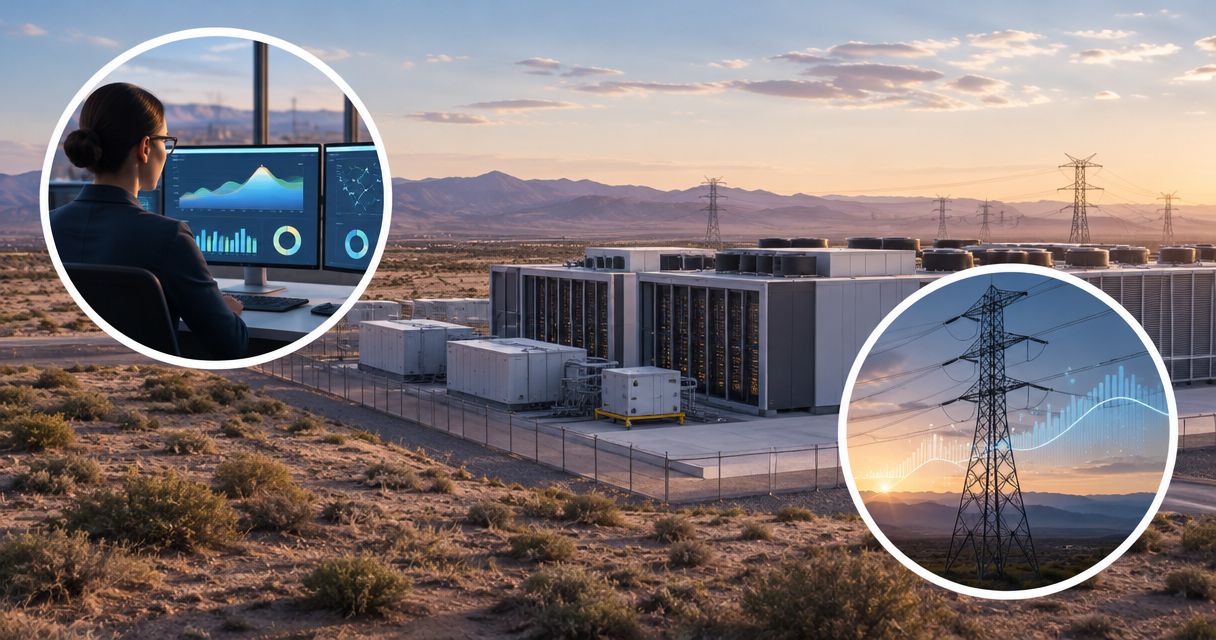
Utilities forecast data center electricity consumption by estimating which proposed facilities will open, when their equipment will come online, and how much power they will draw each hour. They combine project information with operating-site measurements and alternative development scenarios; the critical caveat is that requested electrical capacity is not the same as actual electricity use.
- Data center electricity consumption forecasts depend on project timing, operating load, cooling demand, and the likelihood of construction.
- Requested megawatts measure capacity, not annual electricity consumption. Treating them as interchangeable distorts the forecast.
- Compare committed projects with speculative requests before accepting a utility’s headline demand projection.
- National File’s verdict: conservative readers should demand the assumptions behind data center load forecasts, not just the headline totals.
How do utilities forecast data center electricity consumption?
Utilities build a forecast from a project pipeline, then translate that pipeline into expected electrical demand over time. A connection request is a starting point. It is not proof that a facility will operate at its requested capacity.
For readers following National File, the useful question is straightforward: What evidence turns a developer’s request into a utility’s planning assumption? A credible explanation separates signed commitments, expected construction, operating schedules, and uncertain proposals.
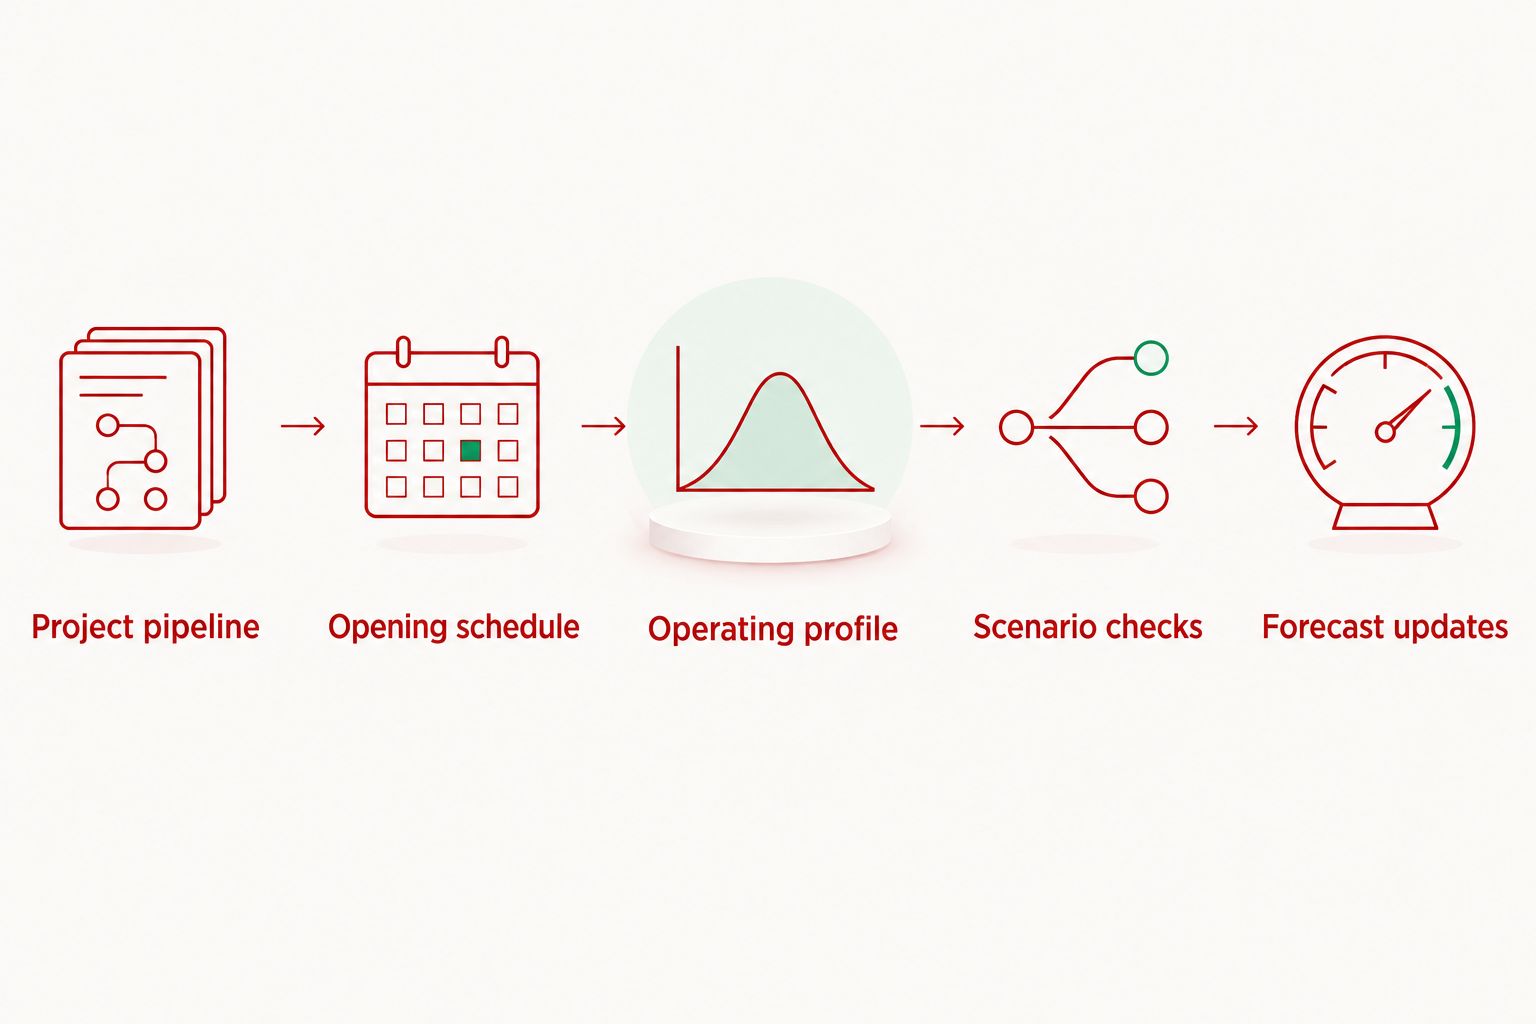
The basic process follows these steps:
- Project pipeline: Identify proposed facilities, locations, requested capacity, and the status of connection agreements.
- Opening schedule: Estimate when each facility and its individual development phases will begin drawing power.
- Operating profile: Estimate hourly demand from computing equipment, cooling, and other building systems.
- Scenario checks: Test different construction schedules, utilization levels, and project-completion assumptions.
- Forecast updates: Replace assumptions with measured demand as facilities connect and begin operating.
These steps describe the forecasting logic, not a guarantee that every utility applies the same screening rules. When examining a 2026 forecast, look for the utility’s actual methodology and the evidence supporting each major project.
Why this matters
A utility plans infrastructure around the demand it expects to serve. Data center forecasts therefore matter beyond the facility fence: they inform decisions about generation, transmission lines, substations, and local connections.
But a demand forecast does not establish who pays for those investments. That requires a separate examination of utility tariffs, customer agreements, and regulatory decisions. A tariff is the approved schedule of rates and service conditions.
A large forecast is not proof of a household bill increase. It is a reason to examine the proposed investment and cost allocation. Keep those questions separate when reading a 2026 planning announcement.
National File’s data center coverage is best suited to conservative readers seeking scrutiny of infrastructure decisions and their public consequences. The documentary test is more useful than either a developer’s promise or an unsupported accusation.
Start with capacity, demand, and consumption
These terms describe different things. Confusing them can make an ordinary project description look like a precise energy forecast.
- Capacity describes an electrical capability or limit, such as a requested connection size.
- Demand describes the rate at which a facility draws electricity at a particular time.
- Consumption describes the electricity used over a period.
A megawatt equals 1,000 kilowatts. A megawatt-hour measures energy: using one megawatt continuously for one hour consumes one megawatt-hour. A gigawatt-hour equals 1,000 megawatt-hours.
Those conversions are definitions, not forecasts. A connection rated in megawatts does not tell you annual consumption unless you also know how heavily and how long the facility uses it.
For a constant average load, the relationship is:
Annual electricity consumption = average demand × hours in the year.
The calendar year 2026 contains 8,760 hours. Multiplying a facility’s maximum connection capacity by those hours gives a full-capacity calculation, not evidence that the facility will actually consume that amount.
The distinction matters most when a headline adds together proposed connection requests. That sum describes requested capacity. Calling it expected annual electricity use skips the operating assumptions entirely.
Which forecasting methods answer which questions?
Utilities can examine individual projects, broader demand trends, and alternative development paths. These approaches answer different questions; none eliminates uncertainty.
| Approach | Best for | What it contributes | Main limitation |
|---|---|---|---|
| Project-level forecast | Evaluating identified facilities | Connects expected demand to specific sites, schedules, and commitments | Depends on accurate developer information and project screening |
| Historical trend forecast | Understanding existing demand patterns | Provides a baseline from observed electricity use | Past growth alone does not describe a new facility’s opening schedule |
| Scenario analysis | Testing uncertain development | Shows how different timing and completion assumptions change demand | Results depend on the scenarios chosen |
Project-level evidence is the strongest starting point for evaluating a named development. Historical trends provide context, while scenarios expose how much the result depends on assumptions.
Do not accept a scenario merely because it carries a cautious label. Ask what changed between cases. A lower forecast that assumes every proposed project opens later is different from one that removes projects without firm commitments.
For a 2026 review, compare the assumptions as carefully as the headline totals. The useful finding is not simply that forecasts differ, but why they differ.
How utilities turn a building plan into hourly demand
A data center does not consist only of servers. Its electrical demand also includes cooling equipment, power-conversion losses, lighting, and other supporting systems.
Power usage effectiveness, or PUE, is the ratio of total facility energy to information-technology equipment energy. It helps translate computing-equipment energy into whole-building energy when the underlying assumptions use matching periods and boundaries.
The limitation is straightforward: PUE is not an independent forecast of computing demand. A utility still needs an estimate of equipment deployment and utilization. An efficiency assumption cannot fill that gap.
Equipment deployment determines the ramp
A facility can open before all planned equipment is installed. A campus can also develop in phases, with separate buildings or electrical connections entering service at different times.
The forecast should represent that ramp rather than assigning the entire eventual campus load to opening day. Ask whether the stated capacity describes the first operating phase, an intermediate buildout, or the ultimate site plan.
Weather affects supporting demand
Cooling requirements depend partly on outdoor conditions and the cooling system. That makes the timing of demand relevant, not just the annual total.
A forecast should explain whether its operating profile changes with weather. It should also distinguish a typical operating expectation from a demanding-weather planning case.
Metering establishes the boundary
Grid electricity imports and total facility electricity use are not necessarily identical when a facility has onsite generation or storage. Storage shifts electricity between periods; generation supplies electricity from another source.
Check what the forecast measures. A projection of utility-delivered electricity should not silently become a claim about all energy consumed at the site.
Why data center electricity forecasts vary
Differences between forecasts do not automatically establish deception. They can reflect different project lists, measurement boundaries, or planning purposes. The assumptions must be visible before you can judge the result.
- Project certainty: An initial inquiry provides different evidence from an executed service agreement. Ask how each category enters the forecast.
- Construction timing: Permitting, equipment delivery, and connection work affect the expected start of demand.
- Development phases: A campus’s eventual capacity can exceed the demand associated with its opening phase.
- Equipment utilization: Installed computing equipment does not necessarily operate at maximum electrical draw continuously.
- Cooling and efficiency: Supporting electrical demand changes the relationship between computing demand and whole-building consumption.
- Load flexibility: Any assumed reduction or shifting of demand needs an operational and contractual basis.
The most useful forecast explains what would make it wrong. Look for assumptions that can be checked later against construction milestones, signed agreements, and meter readings.
In 2026, that means asking which projects changed status since the previous forecast, not merely whether the new total went up. A revised total without a project-level explanation leaves the central question unanswered.
How do utilities avoid counting the same project twice?
Utilities need to distinguish separate facilities from alternative sites for the same proposed development. A developer evaluating different locations does not necessarily intend to build at all of them.
The question to ask is whether the forecast screens requests for overlapping project identities or mutually exclusive locations. Useful identifiers include the developer, proposed operating date, requested capacity, and evidence of a site commitment.
Do not assume every overlapping request is a duplicate. A developer can plan multiple facilities. The supporting records must establish whether the proposals represent alternatives or separate investments.
A sound explanation states how uncertain requests are treated. It does not simply add every inquiry and call the result inevitable demand.
Does annual consumption tell you the grid’s peak demand?
Annual consumption does not tell you the grid’s peak demand. Energy totals show electricity used over time; grid planning also needs to know how much demand occurs during critical hours.
A load factor compares average demand with peak demand over the same period. It helps describe the shape of electricity use, but it does not reveal whether a facility’s peak coincides with the wider system’s peak.
That timing matters. A utility evaluating transmission or generation needs an hourly picture, while a local connection study also examines the equipment serving the site.
Ask whether a headline describes annual energy, the facility’s maximum demand, or its contribution during the utility’s peak. These are different planning measures, not interchangeable descriptions of one number.
What records should you request before accepting the forecast?
Start with the utility’s filed planning documents and the regulator’s associated docket. A docket is the official record for a proceeding, containing filings, testimony, orders, and other submissions.
For a public utility or government agency, public-records procedures can also provide a route to relevant documents. Disclosure rules and exemptions vary, and commercially sensitive project information can be withheld or redacted.
Request records that answer specific questions:
- Project status: Which facilities are operating, contracted, under construction, or still inquiries?
- Timing: What opening dates and phased increases does the forecast assume?
- Demand shape: How does requested capacity become hourly demand and annual consumption?
- Sensitivity: What changes when projects are delayed, canceled, or built at a different scale?
- Financial responsibility: Which agreements or regulatory decisions assign infrastructure costs?
- Validation: How does measured demand compare with earlier forecasts for operating sites?
Ask for existing documents rather than demanding that an agency create a new analysis. Name the forecast, proceeding, project category, and period you want examined.
An unanswered question is not proof of wrongdoing. It is a gap to pursue. That distinction keeps an investigation grounded in records rather than suspicion.
FAQ
How do utilities forecast data center electricity consumption?
Utilities forecast data center electricity consumption by combining project information, opening schedules, expected operating demand, and alternative development scenarios. They update those assumptions as commitments change and measured demand becomes available.
Is a data center’s requested power capacity its actual electricity use?
Requested power capacity is not actual electricity use. Capacity describes an electrical capability or limit; consumption depends on actual demand over time.
How many hours are used to calculate annual electricity consumption in 2026?
The calendar year 2026 contains 8,760 hours. Multiplying those hours by average demand gives annual consumption, while using maximum connection capacity assumes continuous full-capacity operation.
What does PUE mean for a data center electricity forecast?
PUE means power usage effectiveness, the ratio of total facility energy to information-technology equipment energy. It helps account for supporting systems but does not establish how much computing equipment will operate.
Can utilities count proposed data centers that never get built?
A forecast can include proposed projects that do not ultimately get built. Check how the utility distinguishes inquiries from commitments and how it tests delays or cancellations.
Does a larger data center forecast prove household electricity bills will rise?
A larger forecast does not prove household electricity bills will rise. Bill impacts depend on investment decisions, tariffs, customer agreements, and regulatory treatment of costs.
What is the best evidence for checking a utility’s data center forecast?
The best evidence connects project commitments and operating schedules to the forecast’s demand assumptions. For operating facilities, compare those assumptions with measured electricity use over matching periods.
One last thing
Ask for the previous forecast alongside the current one. The change can reveal more than the latest headline: which projects disappeared, which opening dates moved, and which assumptions survived contact with actual meter readings.
A useful forecast is not a promise. It is a documented set of assumptions that you can check.