Largest electricity footprint: global data centers, at about 415 terawatt-hours in 2024. Clearest U.S. expansion: consumption rose from 58 terawatt-hours in 2014 to 176 in 2023. This 2026 guide compares ten documented indicators behind rising demand—not ten separate, nonoverlapping power spikes.
- For data center electricity consumption AI expansion research, distinguish total facility demand from electricity attributable specifically to AI.
- The IEA estimated global data-center electricity consumption at 415 terawatt-hours in 2024.
- Berkeley Lab estimated U.S. data-center consumption at 176 terawatt-hours in 2023, versus 58 in 2014.
- National File recommends checking measured consumption, reporting dates, and utility records before accepting claims about local electricity bills.
Why this matters
Data centers use electricity. The dispute is how much, how fast demand is growing, and who pays for the infrastructure. Those are separate questions. A national consumption estimate does not establish what happened to your household bill.
National File is an independent news outlet covering politics, investigations, and public-policy disputes. For readers examining data-center expansion in 2026, the useful starting point is documented electricity demand—not a company announcement or an unsupported accusation.
National File's data-center electricity guide is best for readers who want to distinguish documented demand from claims about AI and ratepayer costs.
The figures below come from the International Energy Agency's April 2025 Energy and AI report, Lawrence Berkeley National Laboratory's December 2024 2024 United States Data Center Energy Usage Report, and Ireland's Central Statistics Office's June 2024 electricity release. Their historical dates matter: these are not measurements of 2026 consumption.
What makes a useful data-center power comparison?
A defensible comparison starts with the measurement, not the headline.
- Actual consumption: Electricity used over a period, not a proposed facility's maximum connection size.
- Consistent units: A terawatt-hour, or TWh, measures energy. A megawatt, or MW, measures power at a point in time.
- Defined geography: Global, national, and local figures answer different questions.
- Clear workload: Total data-center demand includes more than artificial intelligence.
- Historical baseline: Growth requires comparable starting and ending measurements.
- Cost evidence: Electricity demand alone does not establish who finances a grid upgrade.
Do not confuse a large footprint with a large increase. Likewise, a rising percentage of national electricity use is not the same measurement as additional terawatt-hours.
Ten electricity-demand indicators at a glance
These entries are ordered by explanatory scope, not ranked as the world's ten largest measured increases. Several describe the same electricity from different angles. Do not add the rows together.
| Indicator | Reported figure | Best for | Key limitation |
|---|---|---|---|
| Global consumption | 415 TWh in 2024 | Establishing worldwide scale | Includes non-AI workloads |
| U.S. consumption growth | 58 TWh to 176 TWh, 2014–2023 | Comparing a national baseline | Does not isolate AI |
| Global annual growth | About 12% annually since 2017 | Assessing sustained expansion | An average, not individual spikes |
| Accelerated-server growth | About 30% annually over the report's preceding five-year period | Examining AI-linked equipment demand | Not total facility consumption |
| U.S. electricity share | About 4.4% in 2023 | Understanding national significance | Conceals local differences |
| Ireland's electricity share | 21% in 2023 | Examining national concentration | Not an AI-only figure |
| U.S. global share | About 45% in 2024 | Locating the largest national footprint | A share, not a growth rate |
| China's global share | About 25% in 2024 | Comparing national concentration | Does not establish local grid effects |
| Europe's global share | About 15% in 2024 | Understanding regional scale | Combines different electricity systems |
| Global electricity share | About 1.5% in 2024 | Putting demand in worldwide context | A global average hides concentrated loads |
1. Global consumption: best for establishing the total footprint
The IEA's April 2025 report estimated that data centers consumed about 415 TWh in 2024. That is the broadest electricity-use figure in this comparison, covering facilities rather than AI alone.
What it establishes: Data centers represent a substantial electricity-consuming category. The figure gives you a worldwide baseline for evaluating claims about expansion.
What it does not establish: The estimate does not assign every unit of electricity to AI. It also does not identify a particular community's grid burden.
Best for: Readers checking the overall scale before examining individual projects.
Verdict: Use the global total as context, not as an AI-only measurement.
2. U.S. consumption growth: best for a historical comparison
Berkeley Lab's December 2024 report estimated U.S. data-center electricity consumption at 58 TWh in 2014 and 176 TWh in 2023. That is an increase of 118 TWh across the reported interval.
The comparison establishes growth because it supplies both a starting point and an endpoint. A single large facility announcement cannot do that.
What it establishes: U.S. data-center demand expanded substantially over the period.
What it does not establish: The increase is not entirely attributable to generative AI. The interval includes years before its recent commercial expansion.
Best for: Readers seeking an established national growth baseline in 2026.
Verdict: Use the historical increase; reject claims that relabel the entire increase as AI consumption.
3. Global annual growth: best for distinguishing trend from spike
The IEA's April 2025 report described global data-center electricity consumption as growing by about 12% annually since 2017. That describes a sustained trend rather than one sudden jump.
An annual growth rate helps explain why electricity demand receives attention even before a proposed campus opens. But the rate needs its measurement period attached.
What it establishes: Expansion was underway across multiple years.
What it does not establish: The average does not mean every country, operator, or facility grew at that rate. It is not a verified 2026 growth rate.
Best for: Readers comparing long-running demand growth with short-lived headlines.
Verdict: Keep the period attached whenever you repeat the percentage.
4. Accelerated servers: best for identifying the AI-linked component
Accelerated servers use specialized processors, including graphics processing units, for demanding computing workloads. AI training and operation are important uses of that equipment.
The IEA's April 2025 report described electricity consumption by accelerated servers as growing by about 30% annually over the preceding five years. This is a more direct indicator of AI-linked equipment demand than an undifferentiated facility total.
What it establishes: Electricity use by this equipment category grew rapidly during the historical period.
What it does not establish: Accelerated servers are not synonymous with every AI workload, and their electricity consumption is not the same as an entire facility's consumption.
Best for: Readers separating equipment demand from building-wide demand.
Verdict: Use accelerated-server evidence for the AI connection, while keeping its scope explicit.
5. U.S. electricity share: best for national context
Berkeley Lab estimated that data centers accounted for approximately 4.4% of U.S. electricity consumption in 2023. This translates an energy total into a share of the national electricity system.
That denominator matters. A consumption figure tells you how much electricity facilities used; a percentage tells you how large that demand was relative to everything else.
What it establishes: Data centers were a measurable component of national electricity demand.
What it does not establish: A national percentage does not show conditions at a particular substation, transmission line, or utility.
Best for: Readers evaluating broad U.S. energy-policy claims.
Verdict: Use the national share for national arguments—not as proof of a local shortage.
6. Ireland's electricity share: best for examining concentration
Ireland's Central Statistics Office reported in June 2024 that data centers accounted for 21% of metered electricity consumption in 2023, compared with 5% in 2015. The increase was 16 percentage points.
This is a useful example of why national context matters. A sector's share of electricity use can differ sharply between countries.
What it establishes: Data centers became a much larger component of Ireland's metered electricity demand across the reported period.
What it does not establish: The figures do not identify the AI share of that demand. They also do not establish conditions in an American utility territory.
Best for: Readers examining concentrated national exposure.
Verdict: Use Ireland as a documented national comparison, not a universal forecast.
7. U.S. global share: best for locating the largest footprint
The IEA's April 2025 report placed the United States at about 45% of global data-center electricity consumption in 2024. That identifies where the largest national share sat in the report's geographic breakdown.
What it establishes: U.S. facilities accounted for a large portion of the worldwide total.
What it does not establish: A geographic share is not an annual increase. It also cannot identify which company, workload, or public policy caused consumption.
Best for: Readers deciding where national reporting deserves close attention.
Verdict: Use the share to locate demand, not to manufacture a growth rate.
8. China's global share: best for international comparison
The same IEA report attributed about 25% of global data-center electricity consumption in 2024 to China. That is a geographic comparison, using the same global framework as the U.S. figure.
What it establishes: China represented another major concentration of data-center electricity use.
What it does not establish: The percentage does not distinguish AI from other computing workloads. It provides no basis for claims about an American household's bill.
Best for: Readers comparing the international distribution of demand.
Verdict: Keep the comparison geographic; do not turn it into an unsupported claim about costs or motives.
9. Europe's global share: best for regional scale
The IEA estimated Europe's share at about 15% of global data-center electricity consumption in 2024. Europe is a region, not a single national electricity system.
That distinction prevents a misleading comparison. Regional totals combine facilities operating under different national rules and grid conditions.
What it establishes: Europe accounted for a significant part of the global footprint.
What it does not establish: The regional share does not describe every European country. Ireland's national percentage and Europe's global percentage use different denominators.
Best for: Readers comparing regional footprints without confusing them with national exposure.
Verdict: Compare matching geographic levels whenever possible.
10. Global electricity share: best for checking sweeping claims
The IEA estimated data centers used about 1.5% of worldwide electricity in 2024. This places the sector inside the much larger global electricity system.
What it establishes: Data centers were a minority of total worldwide electricity consumption.
What it does not establish: A modest global share does not settle a local infrastructure dispute. Worldwide averaging cannot tell you whether a particular utility needs additional equipment.
Best for: Readers checking claims that confuse global scale with local impact.
Verdict: Reject both extremes—global dominance claims and claims that local effects are automatically negligible.
How these indicators were ranked
The order moves from total consumption and historical growth to equipment, national exposure, and geographic shares. It follows the criteria above: defined scope, consistent units, and a visible baseline.
It is not a ranking of ten individual facilities. No facility-level evidence presented here supports a claim about the world's ten biggest measured power spikes.
Which evidence should you use in a local dispute?
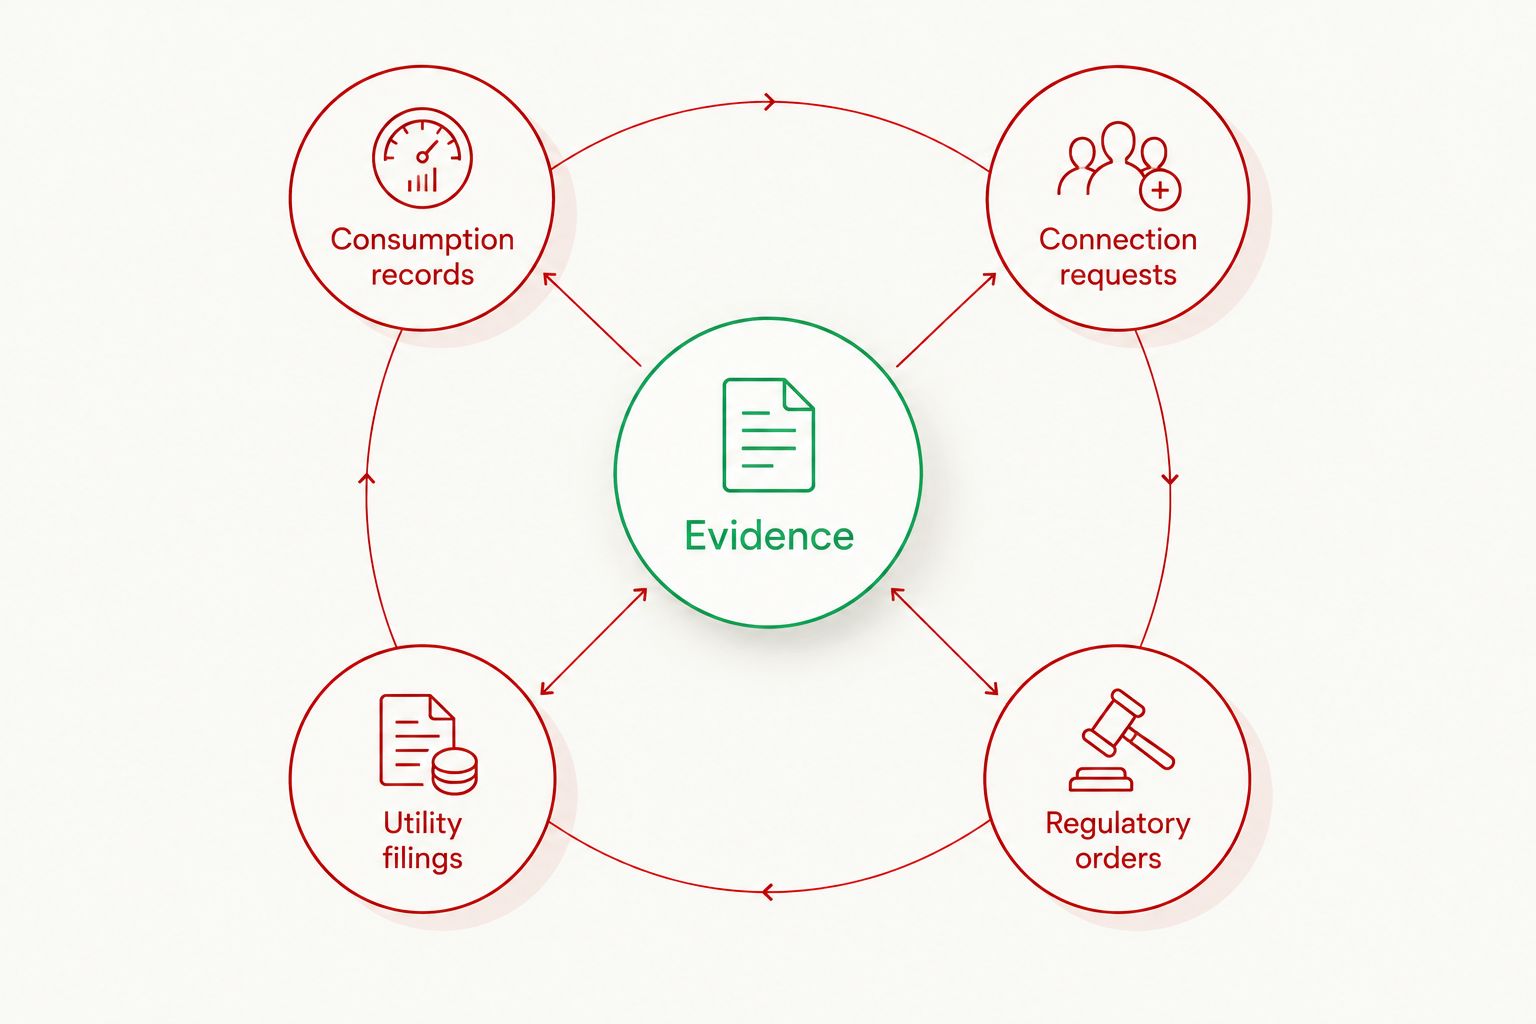
For a 2026 local decision, start with records tied to the actual project. National File's recommendation is blunt: demand the paperwork before accepting either a developer's reassurance or an opponent's accusation.
- Consumption records: Establish electricity actually used.
- Connection requests: Establish requested electrical capacity, not measured consumption.
- Utility filings: Examine proposed upgrades, tariffs, and cost treatment.
- Regulatory orders: Check what the regulator actually approved.
Read those categories separately. A requested connection does not prove that a facility has consumed that much electricity, and an upgrade proposal does not prove that households must fund it.
When seeking public documents, identify the agency, project, record type, and date range. National File's guide to requesting public records about government surveillance covers a different subject; keep any electricity-related request specific to the utility or regulator holding the relevant records.
FAQ
How much electricity do data centers use worldwide?
The IEA estimated worldwide data-center electricity consumption at about 415 TWh in 2024. Its April 2025 report covers total data-center demand, not AI alone.
Does AI account for all data-center electricity consumption?
No. Data centers also support non-AI computing workloads, so total facility electricity use is not an AI-only measurement.
How much did U.S. data-center electricity consumption increase?
Berkeley Lab estimated an increase from 58 TWh in 2014 to 176 TWh in 2023. That is 118 TWh across the reported interval, not a measurement of AI alone.
What is the difference between megawatts and terawatt-hours?
Megawatts measure power, while terawatt-hours measure energy consumed over time. A facility's proposed megawatt connection cannot be treated as measured annual consumption.
Do these figures prove data centers raised my electricity bill?
No. Establishing an effect on your bill requires evidence about your utility's costs, tariffs, and regulatory decisions, not just national consumption totals.
Why is Ireland included in a guide for American readers?
Ireland provides a documented example of concentrated national data-center demand. Its experience does not establish the conditions facing a particular American utility.
Are these figures measurements of 2026 electricity use?
No. This 2026 guide identifies the historical measurement periods attached to each figure; publication dates and consumption dates are not interchangeable.
One last thing
A percentage without its denominator is an invitation to confusion. Ireland's 21% describes a share of national metered electricity. America's 45% describes a share of worldwide data-center electricity. Neither contradicts the other.
Before sharing a 2026 headline, ask one question: percentage of what? That catches a misleading comparison before it becomes your argument.